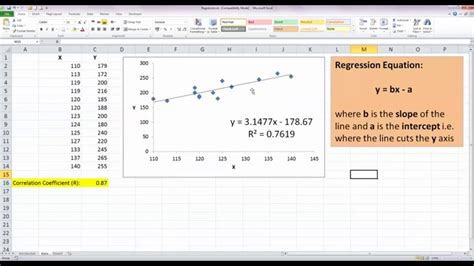
Running Multiple Regression In Excel: 5-Step Process

Are you looking to analyze the relationships between multiple variables in your data? Running multiple regression in Excel can help you uncover valuable insights and make informed decisions. In this article, we will guide you through a 5-step process to perform multiple regression analysis using Excel.
Step 1: Prepare Your Data
Before diving into regression analysis, it is crucial to ensure that your data is clean and organized. Follow these steps to prepare your data:
- Organize your variables: Identify your dependent variable (the outcome you want to predict) and independent variables (the predictors).
- Check for missing data: Remove or impute any missing values in your dataset.
- Check for outliers: Identify any extreme values that may skew your analysis.
- Normalize your data: If your variables have different scales, consider standardizing them to ensure accurate results.
Step 2: Open Excel and Load Your Data
Excel provides a user-friendly interface for performing regression analysis. Follow these steps to load your data:
- Open Excel and create a new workbook.
- Click on the “Data” tab and select “From Text” or “From File” to import your dataset.
- Follow the prompts to load your data into Excel.
Step 3: Perform the Regression Analysis
Now that your data is loaded, you can perform the regression analysis. Follow these steps:
- Select the data range: Highlight the cells containing your dependent and independent variables.
- Click on the “Data Analysis” button in the “Data” tab.
- Select “Regression” from the list of analysis tools and click “OK”.
- In the regression dialog box, select your dependent variable and independent variables.
- Choose the desired output options, such as residuals or confidence intervals.
- Click “OK” to generate the regression analysis results.
Step 4: Interpret the Results
Once the regression analysis is complete, it’s important to interpret the results correctly. Consider the following:
- Regression coefficients: These indicate the strength and direction of the relationship between each independent variable and the dependent variable.
- P-values: These measure the statistical significance of each independent variable. A low p-value suggests a significant relationship.
- R-squared: This value represents the proportion of the variance in the dependent variable that can be explained by the independent variables.
- Residual analysis: Evaluate the residuals to check for any patterns or deviations from the regression line.
Step 5: Visualize and Communicate Your Findings
Visualizing your regression results can help you communicate your findings effectively. Consider the following visualization techniques:
- Scatter plots: Display the relationship between the dependent variable and each independent variable.
- Line charts: Show the regression line and the actual data points.
- Residual plots: Plot the residuals against the predicted values to check for homoscedasticity and linearity.
Conclusion
Running multiple regression in Excel is a powerful tool for analyzing complex relationships between variables. By following the 5-step process outlined in this article, you can effectively perform regression analysis and gain valuable insights from your data.
Frequently Asked Questions
Q: Can I perform multiple regression in Excel?
A: Yes, Excel provides built-in tools for performing multiple regression analysis. By following the steps outlined in this article, you can easily run multiple regression in Excel.
Q: How do I choose my dependent and independent variables?
A: Your dependent variable should be the outcome you want to predict or explain. Independent variables should be predictors that may influence the dependent variable. Consider your research question or hypothesis when selecting variables.
Q: What is the purpose of regression analysis?
A: Regression analysis helps you understand the relationships between variables and make predictions or explanations based on those relationships. It is widely used in various fields, including economics, finance, psychology, and social sciences.
Q: How do I interpret regression coefficients?
A: Regression coefficients indicate the change in the dependent variable associated with a one-unit change in the independent variable, holding all other variables constant. Positive coefficients indicate a positive relationship, while negative coefficients indicate a negative relationship.
Q: What is the significance of p-values in regression analysis?
A: P-values measure the statistical significance of the relationship between independent variables and the dependent variable. A low p-value (typically < 0.05) suggests a significant relationship, indicating that the independent variable has a strong influence on the dependent variable.
