Standard Error Of The Mean (Sem): Explained In English
Welcome to our comprehensive guide on the Standard Error of the Mean (SEM). In this article, we will explain what SEM is, why it is important, and how it is calculated. We will also discuss its significance in statistical analysis and its use in drawing conclusions from sample data. So let’s dive in!
1. Understanding Standard Error of the Mean
The Standard Error of the Mean (SEM) is a statistical measure that quantifies the variability or dispersion of sample means around the population mean. It provides an estimate of how closely the sample mean represents the true population mean.
What is the difference between Standard Error and Standard Deviation?
Before we delve deeper into SEM, let’s clarify the difference between Standard Error (SE) and Standard Deviation (SD). While both measures quantify variability, they serve different purposes:
- Standard Deviation (SD): SD measures the dispersion of individual data points within a sample or population. It provides insight into the spread of the data.
- Standard Error (SE): SE measures the variability of sample means around the population mean. It provides insight into how closely the sample mean represents the true population mean.
2. Importance of Standard Error of the Mean
The SEM is an essential tool in statistical analysis because it helps us draw meaningful conclusions from sample data. Here are a few reasons why SEM is important:
2.1 Assessing Sampling Variability
When conducting research or experiments, it is often impractical or impossible to collect data from an entire population. Instead, we collect data from a sample and use it to make inferences about the population. The SEM allows us to assess the variability of sample means and understand how likely it is that the sample mean accurately represents the population mean.
2.2 Comparing Sample Means
SEM is particularly useful when comparing sample means from different groups or conditions. It provides a measure of the precision of the estimated difference between means. If the SEM is large, it suggests that the difference between means may not be statistically significant, as it could be due to random sampling variability.
2.3 Confidence Interval Estimation
SEM plays a crucial role in estimating confidence intervals. A confidence interval provides a range of values within which we can be confident that the true population mean lies. By incorporating the SEM into the calculation, we can create narrower or wider confidence intervals, depending on the desired level of confidence.
3. Calculating Standard Error of the Mean
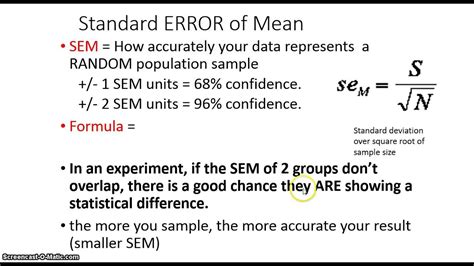
To calculate the SEM, you need to know the standard deviation of the sample data and the sample size. Here is the formula for calculating SEM:
SEM = SD / √n
Where:
- SEM is the Standard Error of the Mean
- SD is the Standard Deviation of the sample data
- n is the sample size
Example Calculation
Let’s say you have a sample of 50 students and want to calculate the SEM of their test scores. The standard deviation of the test scores is 10. Using the formula, the calculation would be:
SEM ≈ 1.41
Therefore, the SEM of the test scores is approximately 1.41.
4. Significance of Standard Error of the Mean
The SEM provides valuable information about the reliability and precision of sample means. Here are a few key points to understand its significance:
4.1 Precision of Sample Means
A smaller SEM indicates that the sample means are clustered more closely around the population mean. This suggests higher precision and greater confidence in the representativeness of the sample mean.
4.2 Larger Sample Size
A larger sample size results in a smaller SEM, as the sample means become more representative of the population mean. Increasing the sample size helps to reduce sampling variability.
4.3 Assessing Statistical Significance
When comparing sample means, the SEM is essential in determining whether the difference between means is statistically significant. If the difference between means is larger than the SEM, it suggests that the difference is unlikely to be due to chance alone.
5. Frequently Asked Questions (FAQs)
Q1: What is the difference between SEM and Standard Deviation?
A1: Standard Deviation (SD) measures the dispersion of individual data points, while Standard Error of the Mean (SEM) measures the variability of sample means around the population mean.
Q2: How is SEM calculated?
A2: SEM is calculated by dividing the standard deviation of the sample data by the square root of the sample size.
Q3: What does a smaller SEM indicate?
A3: A smaller SEM suggests higher precision and greater confidence in the representativeness of the sample mean.
Q4: How does sample size affect SEM?
A4: A larger sample size results in a smaller SEM, as the sample means become more representative of the population mean.
Q5: Why is SEM important in statistical analysis?
A5: SEM helps assess sampling variability, compare sample means, and estimate confidence intervals. It allows us to draw meaningful conclusions from sample data.
Now that you have a thorough understanding of the Standard Error of the Mean (SEM), you can confidently apply it in your statistical analyses and draw accurate conclusions from your sample data.
Sarah Thompson
Sarah Thompson is a career development expert with a passion for helping individuals achieve their professional goals. With over a decade of experience in the field, Sarah specializes in providing practical advice and guidance on job search strategies, cover letters, resumes, and interview techniques. She believes in empowering job seekers with the knowledge and tools necessary to navigate the competitive job market successfully.